Any agent. Any model. Any environment.
Your rules.
Run AI agents on your enterprise systems — any environment, any model, fully governed.

From the makers of the #1 Kubernetes IDE — Trusted by the World's Best Product Teams at


AI agents are everywhere.
Governance isn't.

Every team in your organization is using AI agents. Engineers run them against production clusters. Sales connects them to CRM data. Support wires them into ticketing systems. And IT has no visibility — what's running, what it's accessing, what data is flowing where, what it costs.
Most of this happens on laptops. Claude Desktop, Cursor, Copilot — running with personal credentials, no audit trail, sensitive data flowing to model providers uncontrolled. Cloud agent platforms govern agents on their cloud. But the majority happens outside any platform's view.
The gap between adoption and governance is where breaches happen, compliance fails, and costs spiral.
of organizations report unsanctioned AI use
Running on laptops, with personal credentials, no visibility
Gartner
use AI agents, but only 10% have an identity strategy for them
Agents operate with user credentials — no dedicated identity, no attribution
Oasis Security
of agentic AI projects will fail by 2027
The #1 cause: insufficient governance
Gartner
Three pillars of
governed AI.
Every agent needs tools and connectivity to enterprise systems. Every enterprise needs governance. Lens Agents delivers both — simultaneously, without compromise.

- 01 / Connectivity
Agents that get work done — safely
Every agent needs tools and connectivity to enterprise systems. Lens Agents provides both — governed. An SRE agent querying production clusters. A support agent correlating data across CRM, ticketing, and knowledge bases. A sales agent analyzing pipelines.
- Native integrations: Kubernetes, AWS, and GitHub
- Any system with an API: Salesforce, Jira, ServiceNow, Datadog, PagerDuty — governed through the proxy
- Sandboxed execution for every agent
- Tool registry — connect agents to additional systems, govern access through policy
- 02 / Governance
IT sees everything, controls everything
Every agent gets its own identity. Every connection goes through policy controls. Credentials and sensitive data stay isolated from agents and model providers. IT knows what's running, what it's accessing, and what it costs — across the entire organization.
- Agent identity — dedicated tokens per agent
- Policy engine — domain-level and path-level access controls
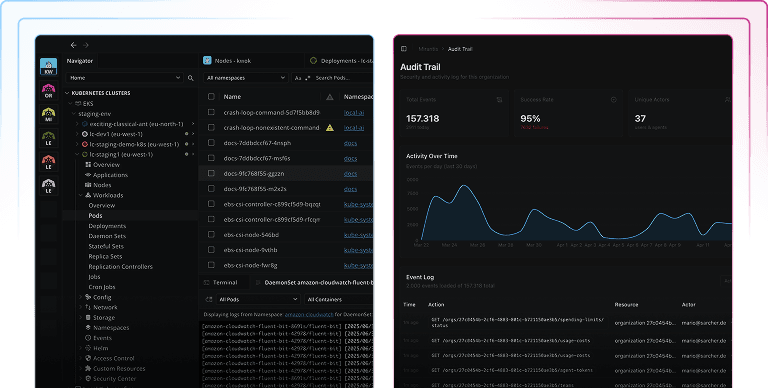
- Full audit trail across every interaction surface
- Active spending enforcement
- 03 / Flexibility
Works everywhere — your cloud, your choice
Cloud or laptop. AWS, Azure, GCP, or on-premises. Claude, GPT, Gemini, Llama, or self-hosted models. Any agent framework. Your governance stays consistent regardless of where agents run or which model they use.
- Governs desktop AI tools — Claude Desktop, Cursor, Copilot
- Governs external agents — any framework, running anywhere
- Any infrastructure — your cloud, on-premises, or hybrid
- One set of policies for every agent, every environment
Your agents. All three kinds.
One platform.
Your teams already use AI agents — on laptops, in the cloud, across frameworks. Lens Agents doesn't replace them. It governs all of them through one platform.
- Desktop AI Tools
Your AI tools. Now governed.
Claude Desktop, Cursor, Copilot, ChatGPT Desktop, Claude Code. Connect them to Lens Agents. Nothing changes for the user. Behind the scenes: policies, credentials, and audit trails apply automatically.
An engineer queries production with Claude Code. Policies control access, credentials are injected by the platform, and the session lands in the audit trail — without changing how the engineer works.
- External Agents
The agents your teams already built — now governed.
LangChain, CrewAI, OpenAI Agents SDK, Google ADK, Claude Agent SDK, or any framework you build with. Running on AWS, Azure, or bare metal. Connect them with agent tokens. Each agent gets its own identity and inherits your governance. No code changes.
One team's LangChain agent on AWS and another team's CrewAI agent on Azure — both governed through one platform, one set of policies.
- Managed Agents
Autonomous agents you create on the platform.
Create agents and configure them through conversation. They monitor infrastructure, triage tickets, run compliance audits — on a schedule, with persistent memory, at the autonomy level you choose. Defined by you in editable workspace files.
"Monitor production pods every 2 hours, alert in Slack if anything is degraded." The agent configures itself and starts working.


Built for every team.
- For Engineering Teams
Your AI tools, connected to production — without changing your workflow.
- For IT & Security Leaders
One platform. One audit trail. Every agent governed.
- For Platform Engineers
Identity, sandboxing, policy engine, audit — skip building it from parts.
- For Business Teams
Create agents for your workflows. IT already approved the platform.
One platform for
every cloud, every laptop,
every model.
Most agent platforms govern one environment — AWS AgentCore on AWS, Microsoft AI Factory on Azure, Google Agent Builder on GCP.
Lens Agents governs agents across all of them — and across the desktop AI tools where most agent usage happens. One set of policies, one audit trail, every environment.
| Feature | Lens Agents | AWS AgentCore | Microsoft AI Factory | Google Agent Builder |
|---|---|---|---|---|
| Any cloud | yes | AWS only | Azure only | GCP only |
| Desktop AI tools | yes | — | — | — |
| Any model | yes | Bedrock | Azure OpenAI | Gemini |
| Active spending enforcement | yes | Monitoring only | Monitoring only | — |
| Managed agents | yes | — | — | — |
Security built
into every layer.
The platform enforces every security property — before agents access systems, before data reaches model providers, before credentials touch agent processes.
- 01
Agent Identity
Every agent gets a dedicated token. Agents authenticate as their own principals — never with user credentials. Clear attribution in every audit entry.
- 02
Credential Isolation
The proxy injects credentials server-side. The agent never sees the raw secret. Even a compromised agent cannot extract credentials.
- 03
Default-Deny Networking
Agents reach only the systems you explicitly approve. Domain-level allowlisting with path restrictions. The platform denies everything else.
- 04
Full Audit Trail
Lens Agents tracks every agent action — tool calls, API requests, shell commands, proxy traffic, model requests, file operations, and sandbox events. Queryable and exportable.
- 05
PII Controls
Define what gets filtered, masked, or blocked — PII, customer data, sensitive information. Controls apply before data reaches agents or model providers.
- 06
Data Sovereignty
Deploy Lens Agents on your cloud, your region, your premises. SaaS, cloud marketplace, or self-hosted. Data stays where you choose.
Enterprise-ready
from day one.
Lens Agents ships with what enterprises actually need — SSO, provisioning, multi-tenant hierarchy, and deployment flexibility.
SSO
SAML and OIDC. Okta, Entra ID, JumpCloud, and others.SCIM
Automated user provisioning and deprovisioning.Multi-tenant
Org, team, and project hierarchy with role-based access control.Deployment options
SaaS, AWS Marketplace, Azure Marketplace, or self-hosted on your infrastructure.Spending controls
Budget limits at org, team, and agent level. Active enforcement — agents stop when limits are reached.Cluster connectivity
Tunnel mode for clusters behind firewalls — no public endpoint, no VPN needed.Admin UI
Manage organizations, teams, projects, agent tokens, policies, and audit trails.SOC 2 + ISO 27001
Certified. Third-party penetration testing and vulnerability bounty program.
Simple pricing.
Platform setup is free. Create your org, configure policies, set up teams. Bring your own LLM provider. Your inference costs go directly to your provider.
2 hours/day × 22 work days/month = 44 agent-hours
24/7 = 720 agent-hours/month
Your agents. Your models.
Your rules. We make it all run safely.
Teams are deploying Lens Agents this week. Yours can be next.